What is the sizing tool?
The green stormwater infrastructure (GSI) sizing tool allows you to explore how changing the site design, soil, and surface will impact the size of the storm that you can reliability manage.
After selecting initial design options, GSI design scenarios are generated, with the option to further refine them. By using the sizing tool, the team will have planning-level designs that can then be used to scale GSI for projects with more than one GSI feature.
How to use the Online Sizing Tool
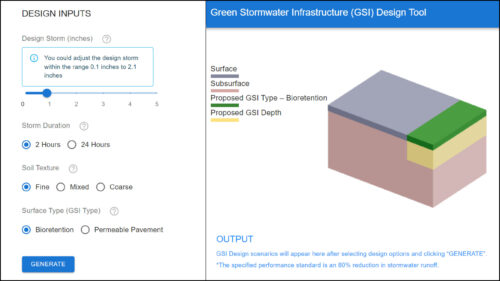
Access the sizing tool to explore GSI design options. It allows the user to input information, including: design storm inches, storm duration, soil texture and GSI type. The user can then generate GSI design scenario output results.
The GSI design scenario output includes a range of differently sized options to meet an 80% reduction in stormwater runoff performance standard. These options vary in (1) design depths (12”, 18”, 24”, and 30” for planted and paved GSI) (2) site loading ratios (1:2, 1:3, and 1:5 for bioretention; 1:1 and direct infiltration, for paved).
The most cost-effective GSI design scenarios are presented first, defined as designs with lower loading ratios and less depth. Users can also explore how different GSI design options impact the size of the storm that can be reliability managed.
Coming Soon: How to use the Online Sizing Tool (video/and written)
Frequently Asked Questions
Fragility curves provide a reliability measure of predictive GSI performance in achieving the desired runoff reduction target. Reliability as a quantitative metric ranges from 0 to 1, representing the probability of reducing runoff by a given reduction standard, when compared to an impervious surface of the same area. The fragility curves reflect the reliability of GSI in achieving an 80% runoff reduction standard—a standard selected as a high, yet achievable target for communities coping with urban flooding challenges. For example, a given GSI installation with 100% reliability could achieve an 80% runoff reduction standard for the selected design storm (e.g., 2 inches over 2 hours). A 90% reliability indicates a 90% chance that the GSI achieves the 80% runoff reduction standard; or conversely, a 10% chance that the GSI fails to meet the runoff reduction standard. The fragility curves reveal that increasing the surface area of GSI (e.g., changing the loading ratio from 1:4 to 1:2) is always more performative than deepening a small installation. In finer soils, with high runoff reduction targets, both surface area and depth are important.
Design prototypes are a complementary visualization of the fragility curves. The design prototypes visualize the GSI design strategies resulting from the fragility curve modeling of varying soils characteristics, GSI depth, rainfall, and loading ratio. The prototypes allow selection of the GSI design meeting the 80% runoff reduction target that would absorb directly into the site at 100% reliability. Prototypes provide a visualization of the range of GSI designs and an estimate of how design affects performance (runoff reduction). As can be seen in the prototypes in finer soils, GSI cannot accommodate the higher loading ratios for high rainfall quantity in short 2-hour durations.
Learn more about the sizing tool
This sizing tool is unique because it uses research from the earthquake risk body of knowledge and applies it to GSI reliability (risk assessment). This approach allows for factors impacting GSI performance, such as design storm, to change over time, allowing stormwater planning process participants to more accurately evaluate the effectiveness of GSI and set performance standards.
To learn more, watch:
Reshmina William, PhD, Civil Engineering What are Reliability Curves and how can I use them in GSI design?
Reshmina William, PhD, Civil Engineering How is GSI modeling used to assess stormwater run off reduction?
Access the full Reliability Curve dataset
Coming Soon How to use the full Reliability Curve dataset